Matches are available for the following sectors: Municipality and Municipal Service Board, Post Secondary Educational Institution, Public Hospital and School Board.
Sub Sector:
Examples include: Municipality, College, University, Acute Hospital, School, etc.
Organization:
The specific Municipality and Municipal Service Board, Post Secondary Educational Institution, Public Hospital and School Board you will receive a match for.
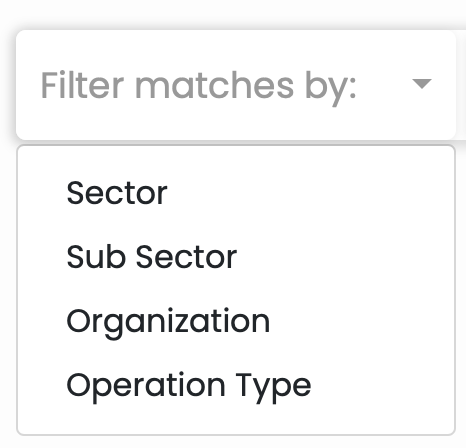
Operation Type:
Examples include: Indoor ice rinks, Community centres, Schools, Facilities used for hospital purposes, etc.
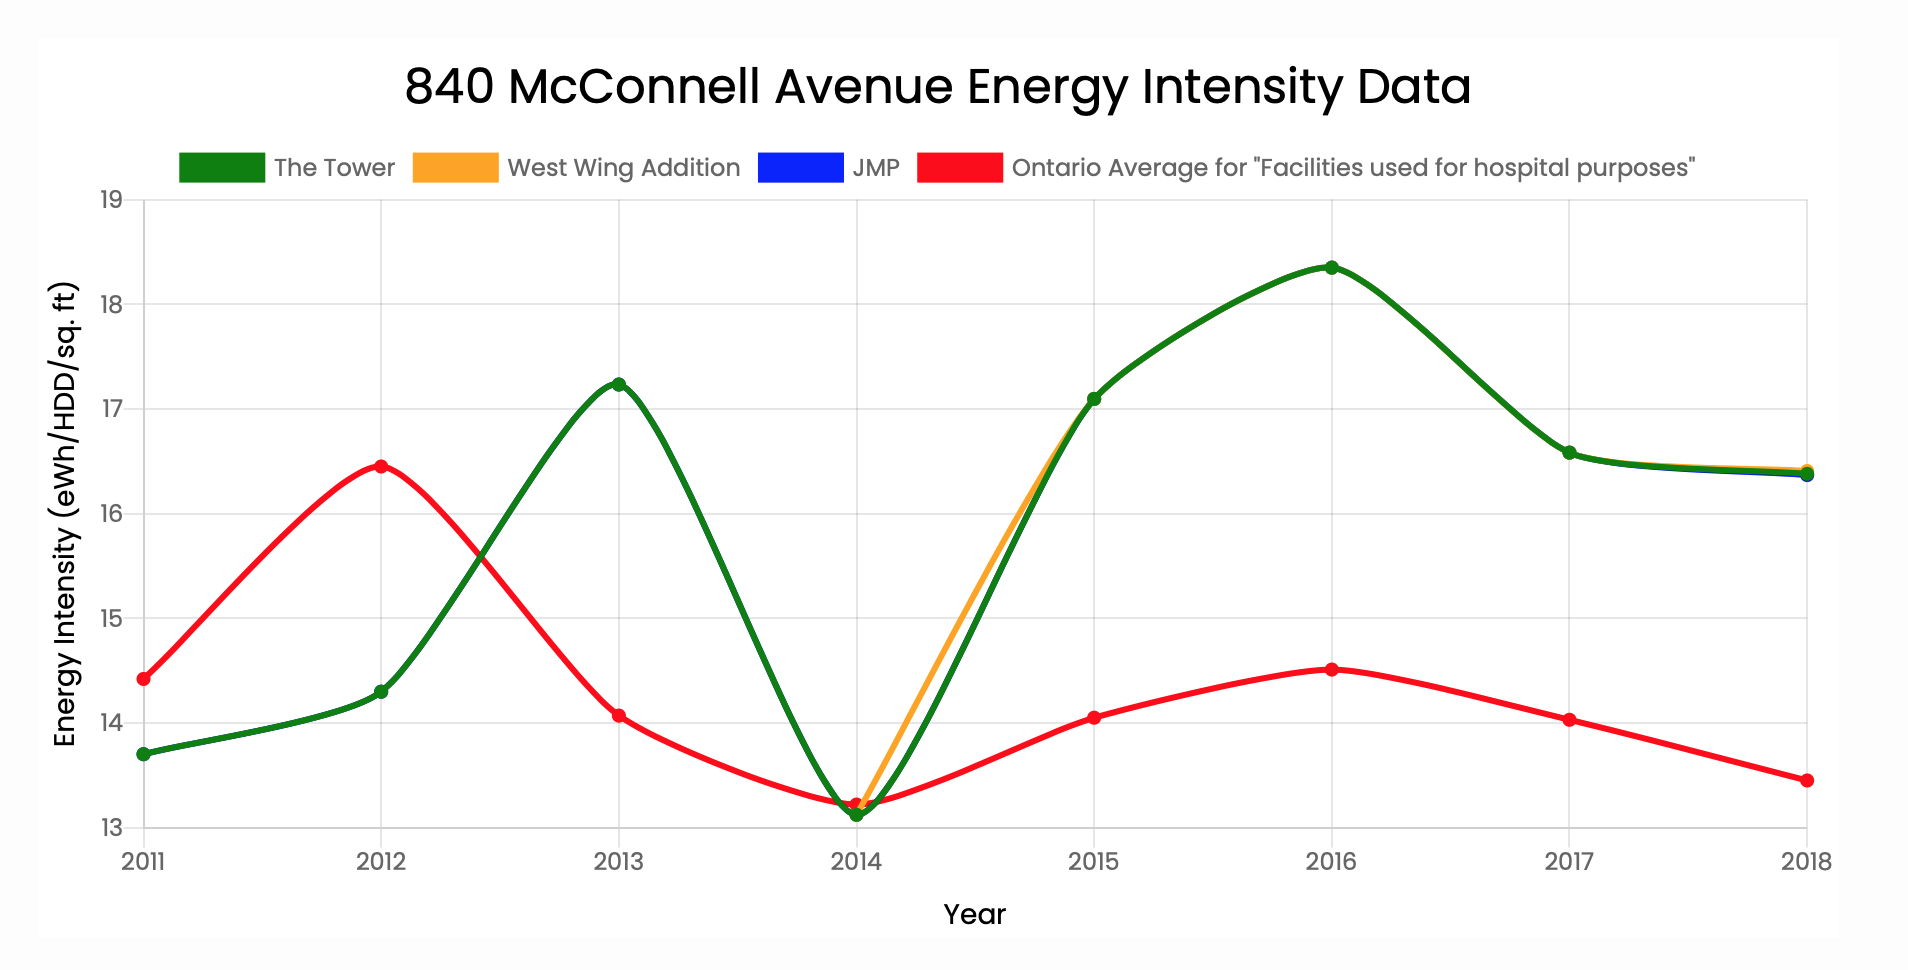
Line Charts
Data is separated by operations at the address. Click on an entry in the legend to remove the dataset from the graph. Eg. The Tower
The "Ontario Average" is calculated after removing outliers based on the IQR method, rounded to 2 decimal places.
The average is not displayed for buildings with the operation type of "Other" due to the large variance in data.
The average is not displayed for GHG data due to the values not being adjusted for weather or area.
A CSV data file and a PNG of the chart can be downloaded by clicking on the respective buttons.
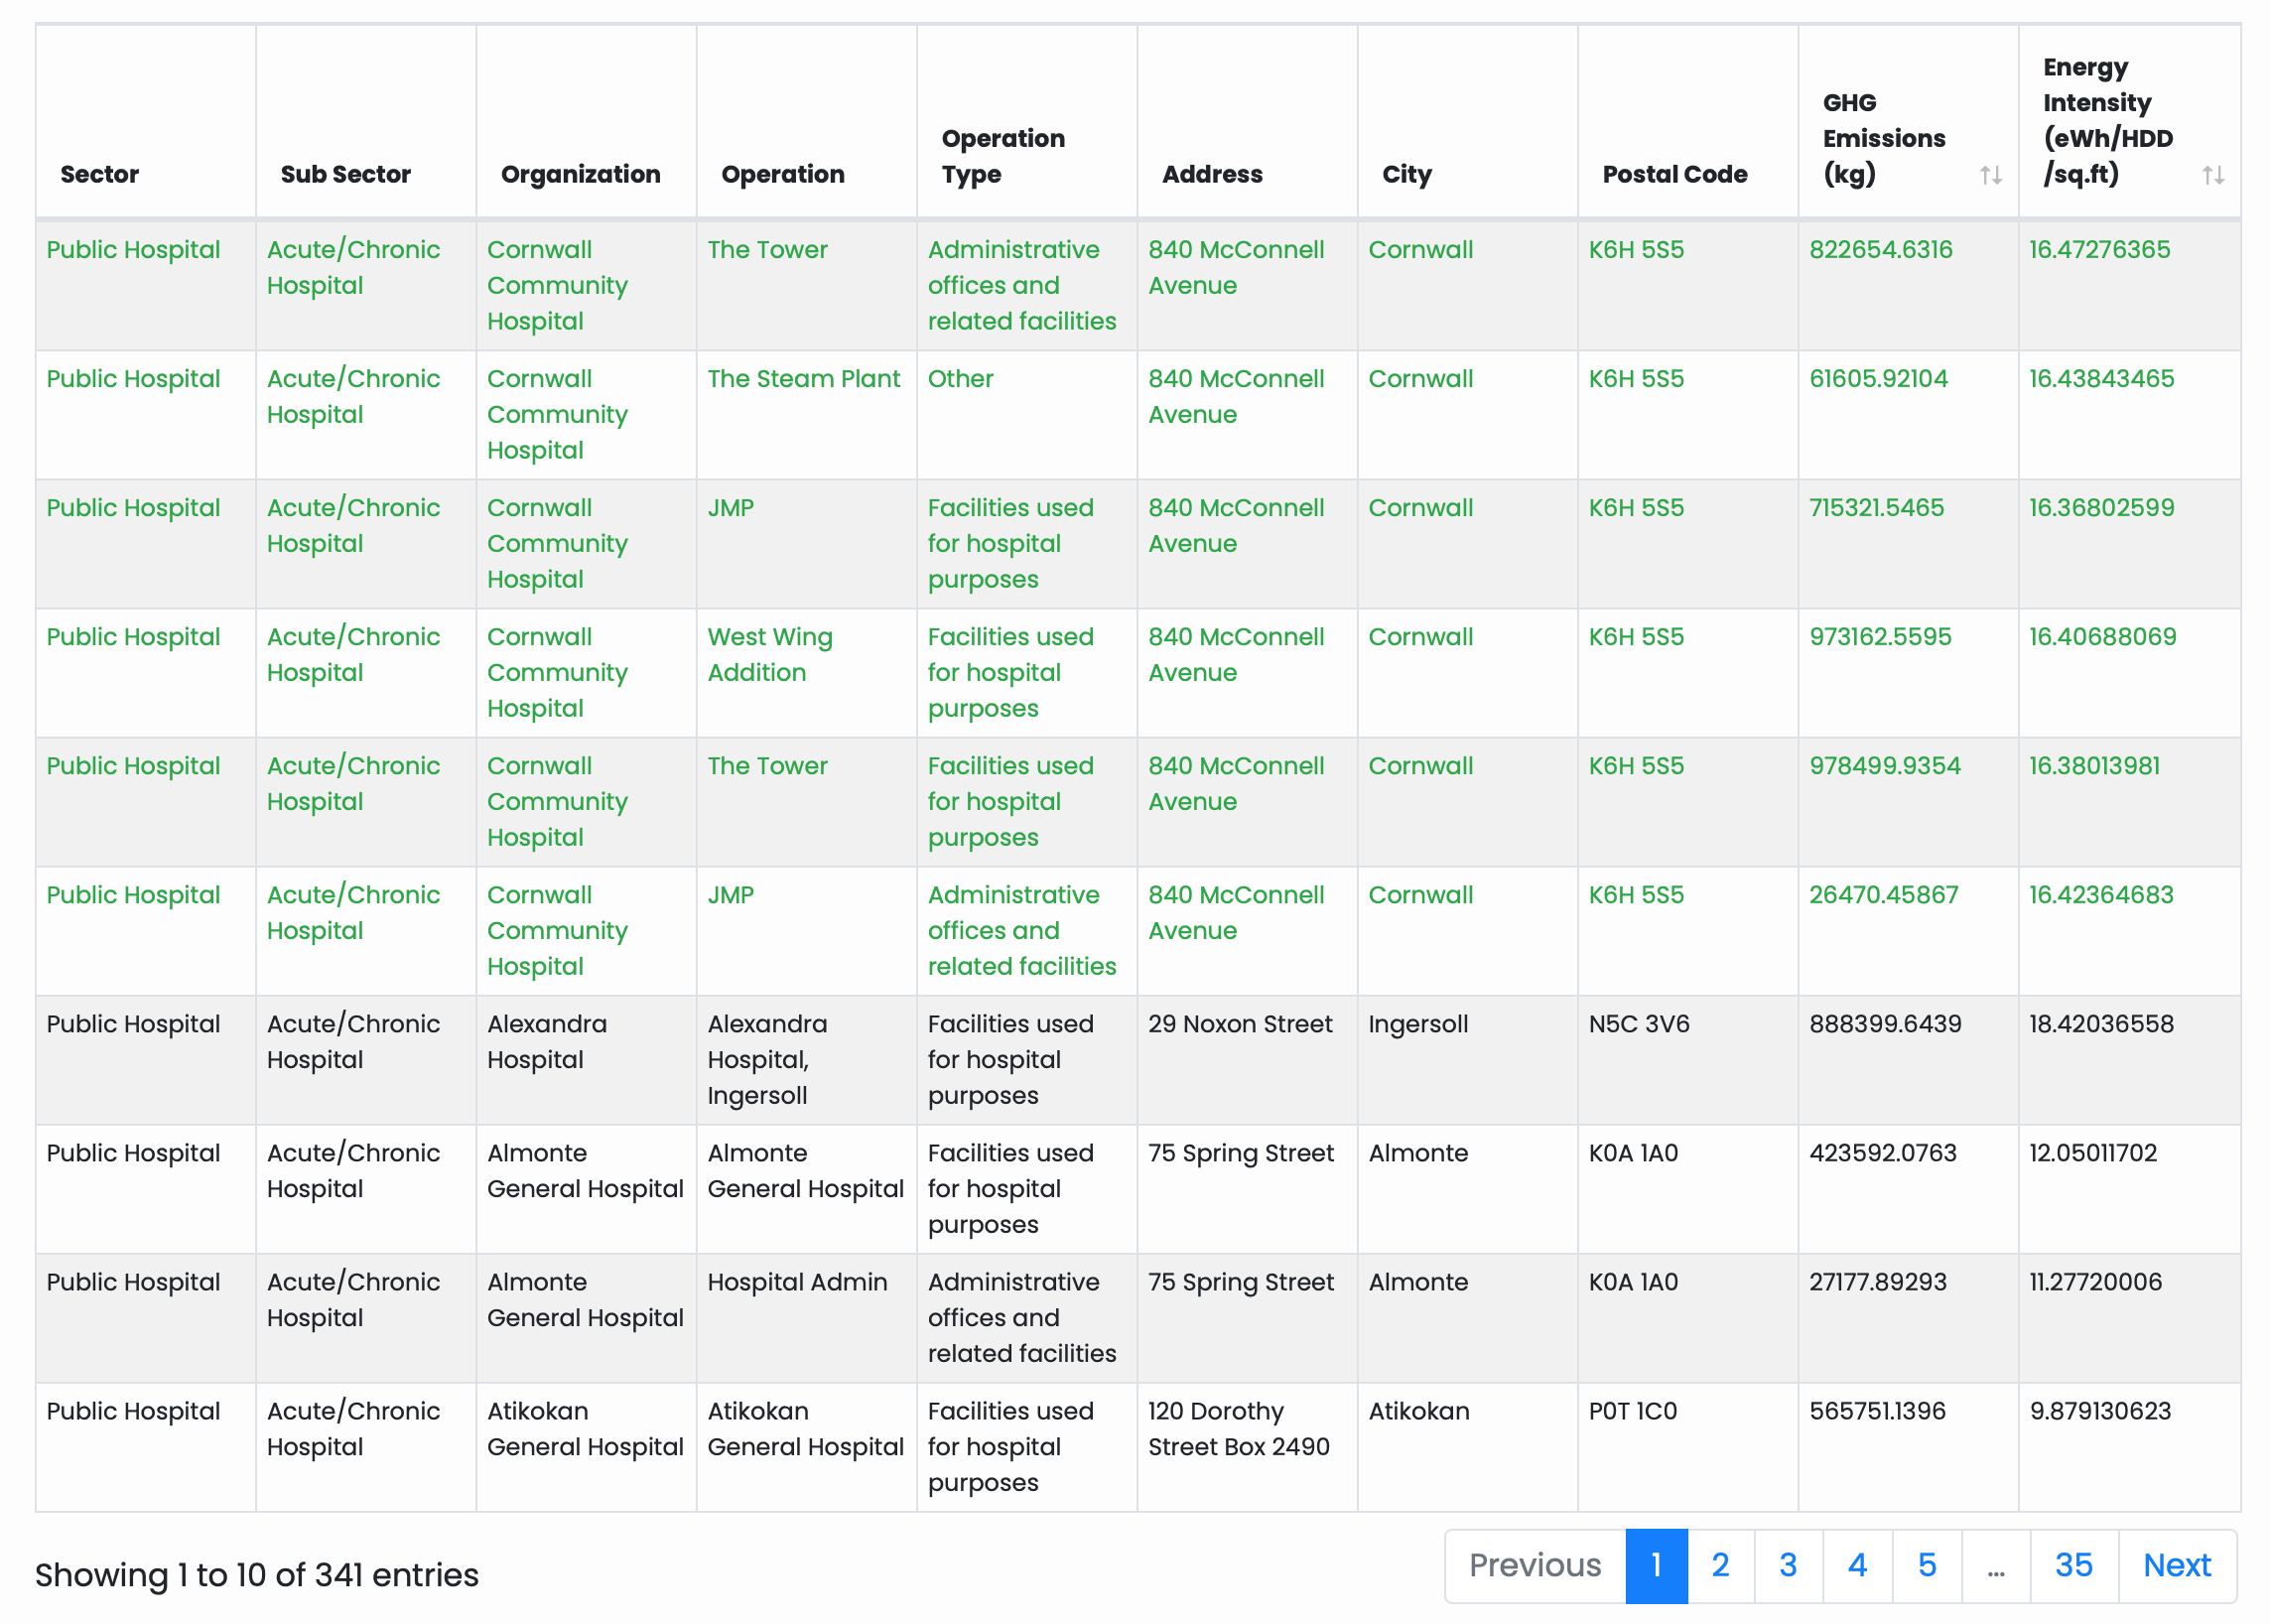
Results Table
Results are displayed based on the selected filtering options.
Operations at the address are displayed in green.
GHG emissions and energy intensity can be sorted by clicking on the respective column titles.